Uma série temporal é uma sequência de pontos de dados, ou observações, que são indexados e ordenados cronologicamente. Geralmente, esses dados são coletados em intervalos sucessivos e igualmente espaçados no tempo, como medições horárias, diárias, mensais ou anuais. A principal finalidade de criar e analisar uma série temporal é identificar padrões não aleatórios em uma variável de interesse. Essa ação possibilita a realização de previsões orientadas à tomada de decisões, permitindo que as organizações se antecipem a eventos e otimizem recursos.
No setor de manufatura, por exemplo, na indústria de cosméticos, em uma etapa de mistura de ingredientes, a análise pode ser utilizada para entender o peso de entrada e saída, o tempo e a homogeneidade de mistura. As séries temporais são frequentemente decompostas em componentes fundamentais para revelar padrões subjacentes, facilitar a interpretação e aprimorar a precisão das análises. A maneira tradicional para análise é através da sua decomposição nas seguintes componentes:
- Tendência (Trend): representa o movimento de longo prazo da série temporal, indicando uma direção geral de ascensão, descendência ou estabilidade;
- Sazonalidade (Seasonality): apresenta um período fixo e conhecido; algumas séries podem ter múltiplos componentes sazonais;
- Ciclo (Cycle): flutuações de aumentos e quedas que ocorrem sem uma frequência fixa ou conhecida, distinguindo-se da sazonalidade por sua irregularidade;
- Resíduo (Residual/Irregularity/Noise): representa o “ruído” ou a parte imprevisível da série temporal que não são explicadas pelos componentes de tendência, sazonalidade ou ciclo.
- Estacionariedade (Stationarity): uma série é considerada estacionária quando suas propriedades estatísticas, como média e variância, não mudam significativamente com o tempo.
Além disso, dados de séries temporais são amplamente utilizadas para acompanhar o desempenho de infraestrutura, hardware ou eventos de aplicativos. Por serem gerados por máquinas em intervalos curtos, esses dados permitem identificar e responder rapidamente a mudanças inesperadas após elas ocorrerem.
Ferramentas, linguagens e visualizações para séries temporais
Para a criação e análise de séries temporais, as linguagens de programação mais utilizadas e com ecossistemas robustos são Python e R. Ambas oferecem uma vasta gama de bibliotecas e ferramentas dedicadas à manipulação, visualização e modelagem de dados. Diversas bibliotecas e frameworks foram desenvolvidos para facilitar a análise de séries temporais, cada um com suas particularidades e focos. Duas das mais utilizadas são o Facebook Prophet e o Statsmodels:
- Facebook Prophet: facilidade de uso e robustez em cenários de negócios com sazonalidade e dados irregulares;
- Statsmodels: biblioteca Python bem estabelecida para análise estatística e econométrica, com suporte robusto para modelos de séries temporais.
Além das ferramentas e linguagens, a visualização permite a identificação de padrões, tendências e anomalias que podem não ser imediatamente óbvias em dados brutos. Para que ela seja eficaz, é fundamental definir o contexto, conhecer o público e escolher um visual adequado. Os tipos de gráficos mais comuns para representar séries temporais são:
Tipo de gráfico | Propósito principal |
Gráfico de linha | Mostrar mudanças em uma ou mais quantidades ao longo do tempo. |
Gráfico de área | Visualizar a soma das séries temporais e a contribuição de cada série para o total. |
Mapa de calor | Visualizar padrões sazonais e diários em períodos mais longos. |
Gráfico de decomposição | Separar a série temporal em componentes de tendência, sazonalidade e resíduo. |
Seguindo o exemplo de uma produção de cosméticos, como um perfume, é possível gerar visualizações que tragam insights relevantes ao considerar variáveis da linha de produção, como:
- Linha de extração de óleos essenciais: destiladores a vapor, prensas a frio e sistemas de extração por solventes;
- Linha de mistura e maceração: tanques de mistura, agitadores e sistemas de controle de temperatura;
- Linha de filtragem e purificação: filtros de alta precisão;
- Linha de envase e embalagem: máquinas de envase automático, seladoras, etiquetadoras e sistemas de controle de qualidade;
- Linha de controle de qualidade: cromatógrafos gasosos e espectrômetro.
Exemplo prático: Série temporal na indústria de Perfumes
Na prática, ferramentas de programação como Python e R permitem a implementação direta de rotinas para coleta, tratamento e modelagem de dados em ambientes industriais. No contexto da indústria de perfumes, sensores instalados em destiladores, tanques de mistura e sistemas de controle térmico geram dados continuamente, como: temperatura, pressão, vazão e composição química. Esses dados podem ser armazenados em bancos e organizados como séries temporais.
Considerando um destilador por arraste de vapor como exemplo de um dos maquinários utilizados na produção de perfumes, diversas variáveis podem influenciar a eficiência da extração. Entre elas, destacam-se:
- Composição química dos óleos essenciais;
- Pressão e temperatura do vapor;
- Rendimento da extração;
- Solubilidade dos compostos;
- Ponto de ebulição dos componentes.
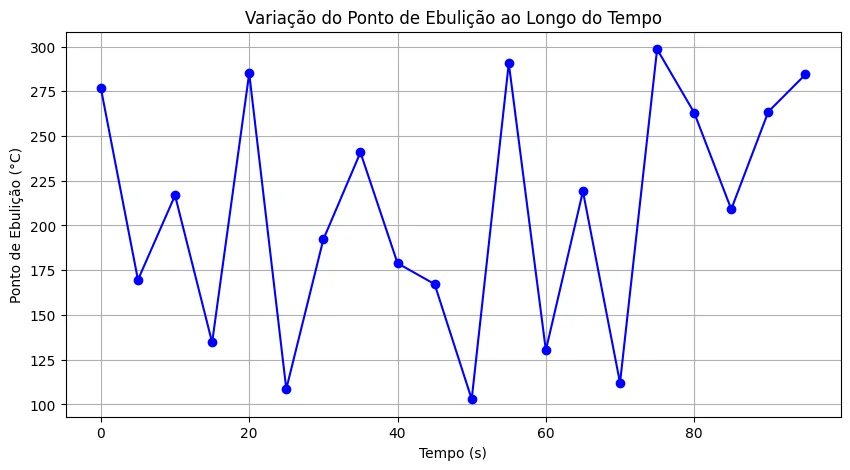
As informações obtidas durante o processo podem ser organizadas por meio de diferentes tipos de gráficos, a depender do objetivo da análise. Por exemplo, se o interesse for acompanhar como a composição química dos óleos essenciais varia ao longo do tempo — com coletas a cada 5 segundos —, um gráfico de linhas é apropriado para visualizar essas mudanças de forma contínua e temporal.
Já para investigar a relação entre a composição química e o ponto de ebulição dos componentes, um gráfico de dispersão é mais indicado. Esse tipo de representação facilita a visualização de correlações entre duas variáveis, o que pode ser útil na identificação de padrões ou agrupamentos de compostos com características semelhantes:
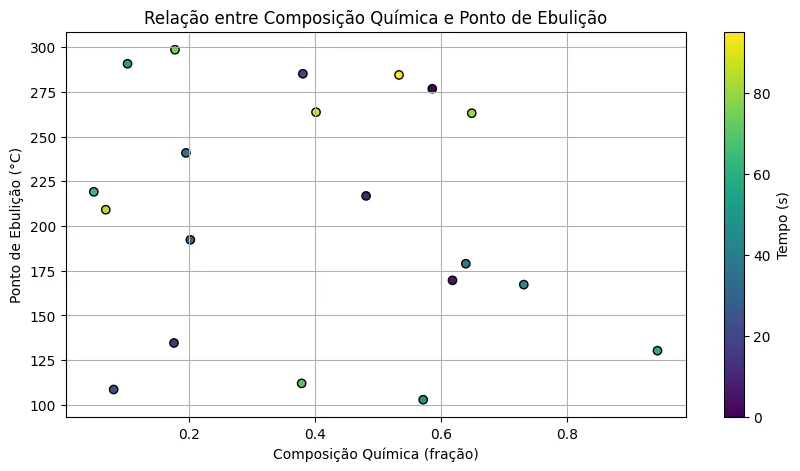
Essa análise é relevante porque a composição química revela quais compostos aromáticos foram efetivamente extraídos da matéria-prima. Por sua vez, o ponto de ebulição auxilia na definição das temperaturas ideais para a extração, permitindo maximizar o rendimento sem causar a degradação de compostos voláteis e sensíveis ao calor.
Séries temporais vs. análises baseadas em eventos
A construção de uma série temporal envolve etapas técnicas que, embora fundamentais, podem ser bastante complexas. O primeiro desafio está na coleta e sincronização dos dados, especialmente em ambientes industriais, como a produção de perfumes, onde sensores distintos registram informações em diferentes frequências e formatos. Para garantir uma linha do tempo unificada, é necessário padronizar os dados por meio de reamostragem ou interpolação.
Na sequência, o pré-processamento exige atenção à limpeza dos dados, remoção de outliers e tratamento de falhas, garantindo que o ruído não comprometa a análise. Além disso, muitos modelos estatísticos, como o ARIMA, exigem estacionariedade, o que demanda transformações como diferenciação ou normalização da série.
A modelagem é outra etapa crítica. A escolha adequada das ferramentas de construção da série temporal (linguagem de programação, bibliotecas etc.) depende do tipo de dado, do comportamento da série e da finalidade da previsão.
Por fim, a integração com o processo produtivo representa um desafio adicional. É necessário automatizar pipelines, atualizar os modelos continuamente e conectá-los aos sistemas de controle. Quando bem implementadas, essas séries temporais tornam-se ferramentas decisivas para a otimização da produção, manutenção preditiva e melhoria da qualidade na indústria de cosméticos.
Diante da complexidade envolvida na construção de séries temporais — que abrange desde a coleta contínua e sincronizada de dados até a modelagem e a integração com os processos produtivos —, torna-se evidente o valor dessas séries para as análises preditivas. Além disso, elas desempenham um papel fundamental na compreensão aprofundada do comportamento dos sistemas ao longo do tempo.
Em contrapartida, há abordagens mais pontuais, como a análise baseada em eventos, que se concentra apenas em momentos específicos de interesse. As séries temporais oferecem um panorama contínuo que permite identificar padrões, tendências e relações causais. Já a abordagem por eventos é acionada apenas quando há uma ocorrência fora do esperado, como uma súbita alteração no ponto de ebulição durante o aquecimento de uma mistura.
Esse tipo de coleta de dados pode ser útil quando o foco está exclusivamente na detecção de anomalias, uma vez que se concentra em eventos específicos. No entanto, ao desconsiderar os dados intermediários que antecedem essas alterações, corre-se o risco de interpretar a situação de forma distorcida. Isso ocorre, pois não se compreende completamente o percurso que levou ao pico ou à anomalia observada.
Saiba mais sobre a ST-One.