Um estudo divulgado em 2022, pela Confederação Nacional da Indústria (CNI), indica que 69% de empresas industriais já utilizaram pelo menos uma tecnologia digital, dentre uma lista de 18 categorias. No entanto, a maioria delas utilizava uma baixa quantidade dessas ferramentas, indicando uma fase inaugural no processo de digitalização:
Uso de tecnologias digitais em indústria
Fonte de referência: Confederação Nacional da Indústria (CNI)
O professor da Fundação Vanzolini, Ricardo Caruso, define: “[…] do ponto de vista da produção industrial, conectividade refere-se à capacidade de integrar digitalmente equipes e equipamentos, possibilitando a troca contínua de dados ao longo do processo produtivo”.
Sendo assim, a conectividade no ambiente industrial contribui para decisões mais rápidas e baseadas em dados precisos. Os eventos da linha de produção passam a ser visualizados em tempo real por todas as áreas.
Como exemplo, Caruso cita que a área de qualidade pode tratar um desvio assim que ele for detectado pelo chão-de-fábrica. A interrupção de um equipamento pode gerar automaticamente um chamado para a manutenção, enquanto simultaneamente notifica a equipe de planejamento sobre a indisponibilidade
Em setembro de 2021, a Agência Brasileira de Desenvolvimento Industrial (ABDI), publicou resultados de uma amostragem de soluções em TI para as indústrias. Softwares de gestão avançada da produção e soluções de big data são utilizadas por 70% e 19% de indústrias, respectivamente:
Fonte de referência: Agência Brasileira de Desenvolvimento Industrial (ABDI)
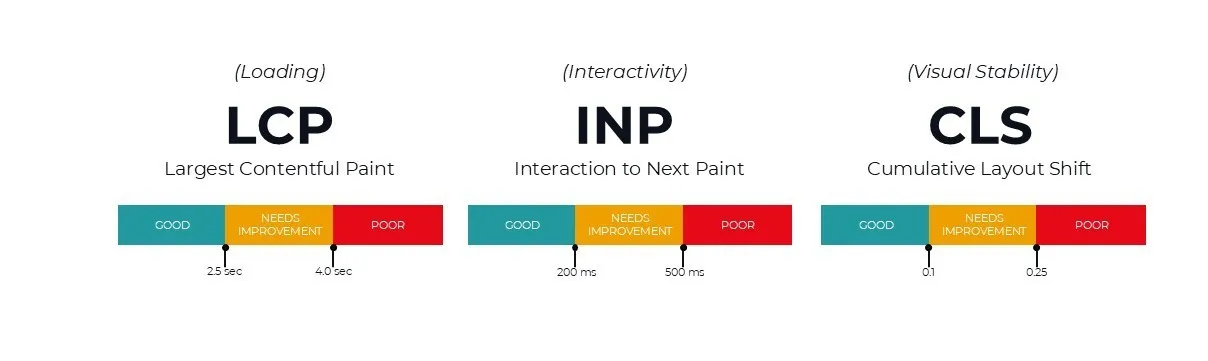
Garantir uma experiência de usuário de alta qualidade é essencial para a sustentabilidade e o sucesso de qualquer sistema na web ao longo do tempo. Nesse sentido, as métricas de front-end medem a experiência real do usuário em relação à velocidade de carregamento, à capacidade de interação e à estabilidade visual de uma página:
Para Marc Reinan Gomes, pós-graduado em Liderança Técnica: “[…] As Core Web Vitals se tornaram nosso norte para medir a qualidade da experiência em nosso produto. Essas métricas nos dão uma visão clara de onde nossa aplicação está falhando ou prosperando.”
Paralelamente, as métricas de observabilidade referem-se ao monitoramento, mensuração e entendimento do estado interno de um sistema ou aplicação, analisando seus resultados, logs e métricas de desempenho. Marc explica: “[…] implementar observabilidade efetiva significa instrumentar nosso código para capturar não apenas erros, mas também padrões de uso, gargalos de performance e pontos de fricção na jornada do usuário.”
Front-end e usabilidade no ambiente industrial
Para exemplificar o processo de digitalização, é possível utilizar métricas de front-end aplicadas a uma plataforma que coleta dados de maquinário industrial, com foco na performance e na usabilidade da interface. Essas métricas são essenciais para garantir que os usuários tenham uma experiência fluida e eficiente durante o uso de alguma página, plataforma ou sistema:
Métrica | Valor ideal | Valor real | Impacto observado |
LCP | ≤ 2,5 s | 2,2 segundos | O gráfico de produtividade carrega rapidamente na tela inicial, causando boa impressão. |
INP | ≤ 200 ms | 180 ms | Os filtros respondem rapidamente aos cliques, garantindo navegação fluida. |
CLS | ≤ 0,1 | 0,05 | A interface se mantém estável durante o carregamento, sem alterações inesperadas. |
Modelo fictício com métricas positivas
Em relação a usabilidade, nesse exemplo, é possível concluir:
- O feedback visual é instantâneo após interações, como a seleção de máquinas ou datas, melhorando a experiência do operador;
- O carregamento de dados em tempo real foi otimizado para que não bloqueie elementos essenciais da interface;
- O Layout é responsivo e estável, com poucos deslocamentos, mesmo em telas menores como tablets industriais.
Em contrapartida, é possível imaginar um cenário em que a plataforma em questão esteja enfrentando problemas de performance:
Métrica | Valor ideal | Valor real | Impacto negativo |
LCP | ≤ 2,5 s | 5,8 segundos | O gráfico de produção demora para carregar, gerando frustração logo na primeira interação. |
INP | ≤ 200 ms | 650 ms | A resposta lenta dos filtros e gráficos dá a impressão de que o sistema travou. |
CLS | ≤ 0,1 | 0,32 | Movimentos inesperados durante o carregamento causam cliques incorretos e perda de dados. |
Modelo fictício com métricas negativas
Nesse caso, sobre a usabilidade é possível concluir:
- Sensação de lentidão ao abrir a plataforma, especialmente em redes industriais com conectividade limitada;
- Interações imprecisas, como clicar em botões que se deslocaram por causa de instabilidade no layout;
- Falta de respostas rápidas e confiáveis para tomada de decisões operacionais.
As fábricas costumam estar em áreas indústrias com baixa densidade urbana, trazendo algumas limitações. Trazendo os exemplos para a realidade brasileira, em ambientes fabris, a programação para estruturar métricas de front-end exige uma abordagem que considere alguns fatores. A instabilidade na conexão, variabilidade de infraestrutura local, intermitência de conexão e diversidade de dispositivos são alguns deles.
“[…] A realidade das redes industriais é bem diferente do que estamos acostumados. Muitas vezes trabalhamos com conexões que oscilam entre 3G e banda larga, e nossa aplicação precisa funcionar bem em ambos os cenários”, comenta Marc Reinan.
Diante desses desafios, torna-se ainda mais importante selecionar adequadamente as ferramentas utilizadas para monitorar o desempenho da aplicação nesses contextos. Para a coleta de dados, podem ser empregadas bibliotecas específicas ou APIs nativas. Um exemplo é a JavaScript Performance API, que permite medir automaticamente métricas como tempo de resposta, renderização e interações do usuário:
					// Medindo tempo de carregamento
window.addEventListener('load', () => {
  const timing = window.performance.timing;
  const pageLoadTime = timing.loadEventEnd - timing.navigationStart;
  enviarMetrica('page_load_time', pageLoadTime);
});
Exemplo fictício de coleta
Usabilidade & navegação rápida – sem lag na linha de produção
Embora atuem em momentos distintos da experiência do usuário, a usabilidade e a velocidade de navegação impactam diretamente na percepção de eficiência e qualidade da plataforma. Uma consulta em um banco de dados extenso pode gerar atrasos críticos na entrega da informação, enquanto uma navegação lenta pode comprometer o ritmo com que o usuário interage com o sistema.
A espera prolongada por respostas pode prejudicar decisões importantes, especialmente em contextos fabris, onde o tempo e a precisão da informação são fatores estratégicos. Além disso, a lentidão nessas operações pode criar uma percepção negativa sobre a estabilidade do sistema, mesmo que a falha esteja localizada apenas na estrutura de dados.
Por outro lado, a velocidade de navegação influencia diretamente a experiência de uso no cotidiano, promovendo maior engajamento com a plataforma. Uma interface responsiva e intuitiva reduz a carga cognitiva do usuário, aumenta a eficiência na execução de tarefas e contribui para uma percepção positiva do produto como um todo.
A partir da adoção de tecnologias digitais, entre as empresas entrevistadas pela CNI, 72% relataram aumento na produtividade do dia a dia. Além disso, 60% declararam uma melhoria significativa da qualidade dos produtos ou serviços e redução dos custos operacionais. Marc explica: “[…] quando você otimiza um sistema que é usado 24 horas por dia por várias pessoas, cada segundo economizado se multiplica exponencialmente.”
No entanto, é importante lembrar que a performance de navegação e desempenho em consultas são complementares e otimizar apenas um deles não garante uma boa usabilidade. Para oferecer uma experiência realmente satisfatória, é essencial que tanto a estrutura de dados quanto a interface sejam pensadas de forma integrada, com foco em desempenho, fluidez e confiabilidade.
“[…]so muito o conceito de ‘perceived performance’. Nem sempre posso fazer uma consulta ser mais rápida, mas posso fazer o usuário sentir que a interface está reagindo através de skeletons, progressive loading e feedback adequado”, menciona Marc.
Saiba mais sobre a ST-One.