Speed Losses, ou perda de cadência, é uma das formas mais recorrentes de perda de capacidade produtiva dentro da indústria, pois ocorre sem que a linha paralise completamente. Mesmo que o processo continue e os maquinários sigam em operação, o volume esperado para aquele turno não é atingido. Dentro do OEE, essa condição aparece principalmente no componente de performance.
A performance é responsável por medir a diferença entre a expectativa para aquela linha, em velocidade ideal, e a realidade do que efetivamente foi produzido durante o funcionamento. Na prática, isso significa que uma operação pode apresentar poucas paradas relevantes e, mesmo assim, encerrar o turno com perda significativa de capacidade.
O problema central desse tipo de perda está no fato de que ela raramente se manifesta como um evento isolado ou evidente. Em vez disso, ela surge como um acúmulo de pequenas reduções de velocidade distribuídas ao longo da operação. Em muitos casos, a perda de cadência passa a ser utilizada como mecanismo informal de estabilização do processo, especialmente quando determinadas condições aumentam a frequência de intervenções.
Essa dinâmica costuma se tornar ainda mais complexa porque speed losses permanece em uma zona de interpretação compartilhada entre diferentes áreas da fábrica, por exemplo:
- A área de produção entende que está preservando a estabilidade operacional;
- A área de manutenção considera que o equipamento não apresenta falhas críticas;
- A área de qualidade entende que operar em velocidades mais elevadas pode aumentar índices de rejeição.
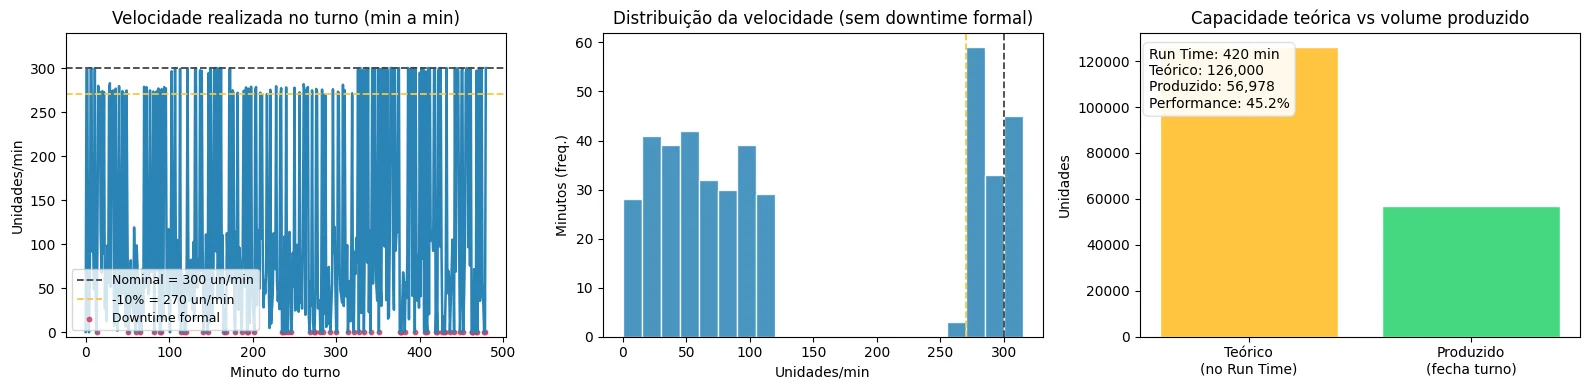
Por exemplo, em uma linha de envase de condimentos e molhos, a operação pode reduzir velocidade em aproximadamente 10% para diminuir rejeições relacionadas à variação de enchimento. A linha continua produzindo normalmente e praticamente não registra downtime formal. Entretanto, ao analisar a distribuição de velocidade realizada ao longo do turno, torna-se evidente que a linha permaneceu durante horas operando abaixo da condição nominal.
Como identificar perdas de cadência na rotina industrial
Para identificar speed losses de forma estruturada, é preciso compreender como a perda se distribui ao longo de um turno. Em muitos casos, a percepção operacional da fábrica continua associada apenas às grandes paradas, enquanto reduções prolongadas de velocidade permanecem diluídas dentro do tempo considerado produtivo.
Considerando a linha de envase de condimentos e molhos, a velocidade nominal pode estar configurada em 300 unidades por minuto durante um turno de 8 horas. Ao encerrar a produção, a equipe identifica aproximadamente 60 minutos de paradas evidentes relacionadas a troca de produto, ajustes maiores e intervenções prolongadas.
A leitura inicial da operação sugere que o turno apresentou desempenho relativamente estável, já que a maior parte do tempo foi considerada produtiva. Entretanto, ao comparar o potencial teórico da linha com o volume efetivamente produzido, a diferença se torna evidente. Considerando 420 minutos de linha em funcionamento, a capacidade teórica seria de 126.000 unidades. Ainda assim, o fechamento do turno aponta apenas 108.000 unidades produzidas.
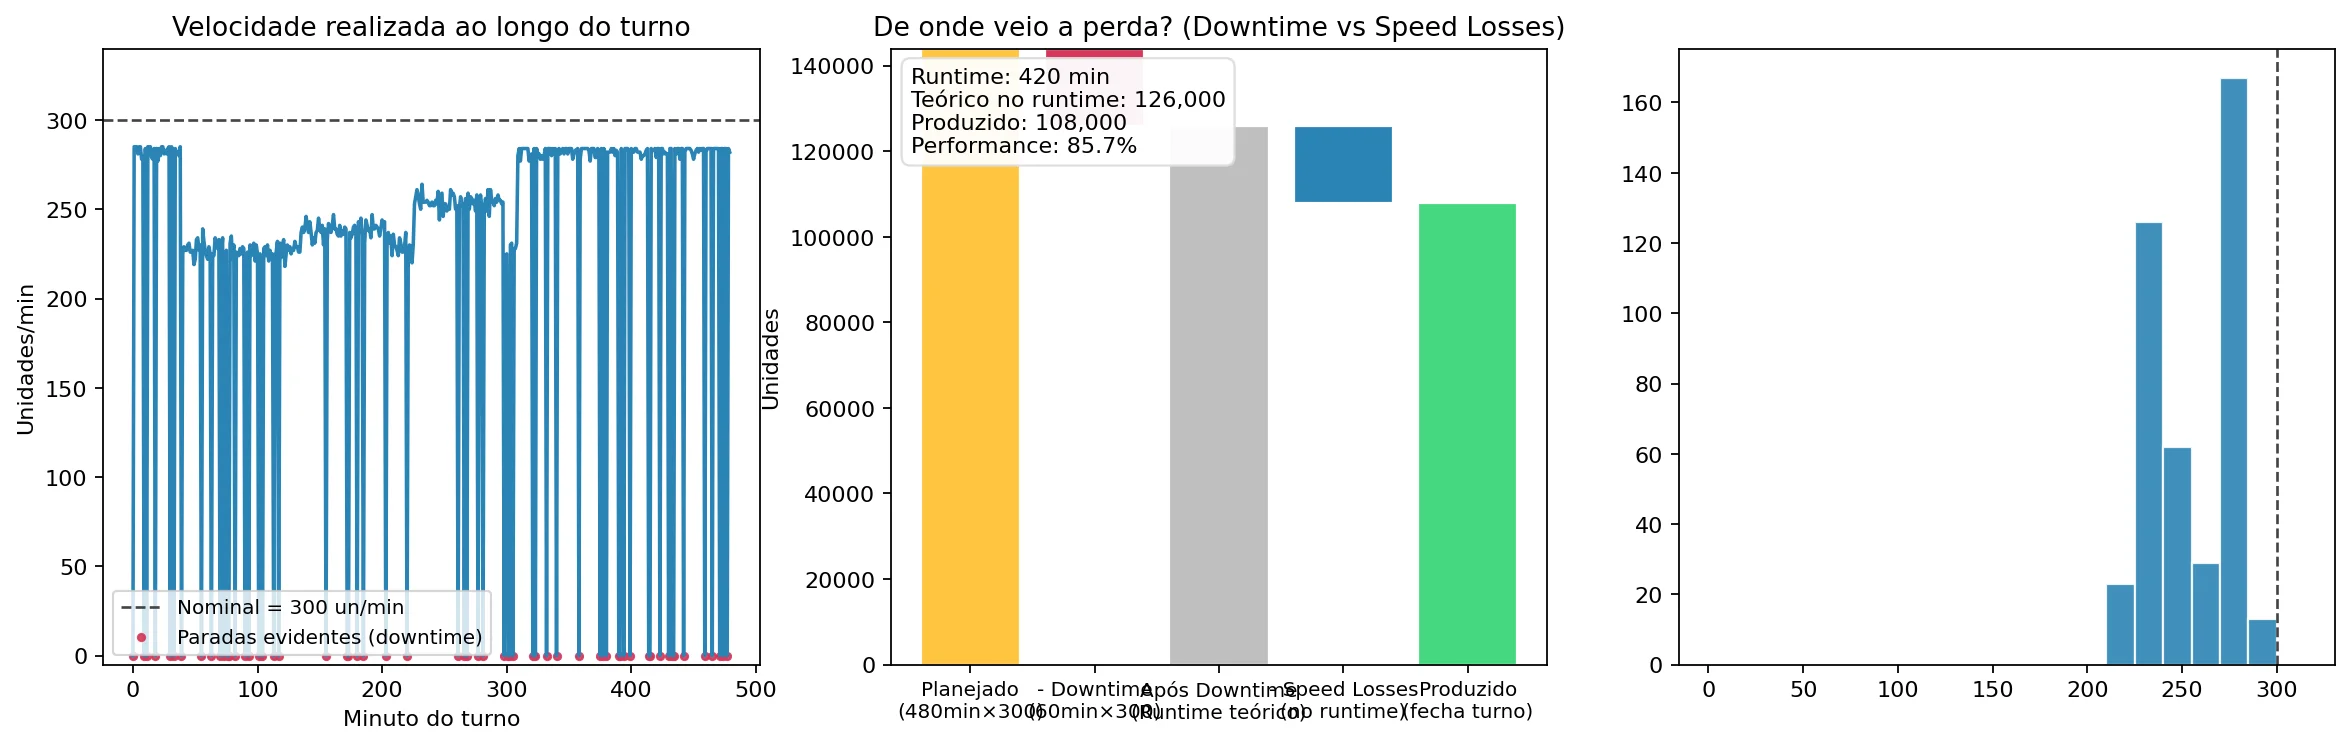
Nesse cenário, a perda de cadência normalmente se manifesta como consequência de longos períodos operando em velocidades intermediárias, sem que a linha efetivamente pare. Em operações de envase de produtos viscosos, pequenas alterações nas condições do processo podem impactar estabilidade, repetibilidade de enchimento e comportamento do produto. Como resposta, a operação tende a reduzir velocidade para diminuir intervenções e preservar qualidade.
A maior dificuldade é que, sem contexto operacional adequado, todas essas condições acabam sendo interpretadas apenas como “instabilidade”, dificultando a identificação da origem real da perda. Nesse ponto, o desafio deixa de ser apenas coletar dados e passa a envolver a transformação de sinais dispersos em informação operacional contextualizada.
TPM, OEE e speed losses como estratégia na rotina industrial
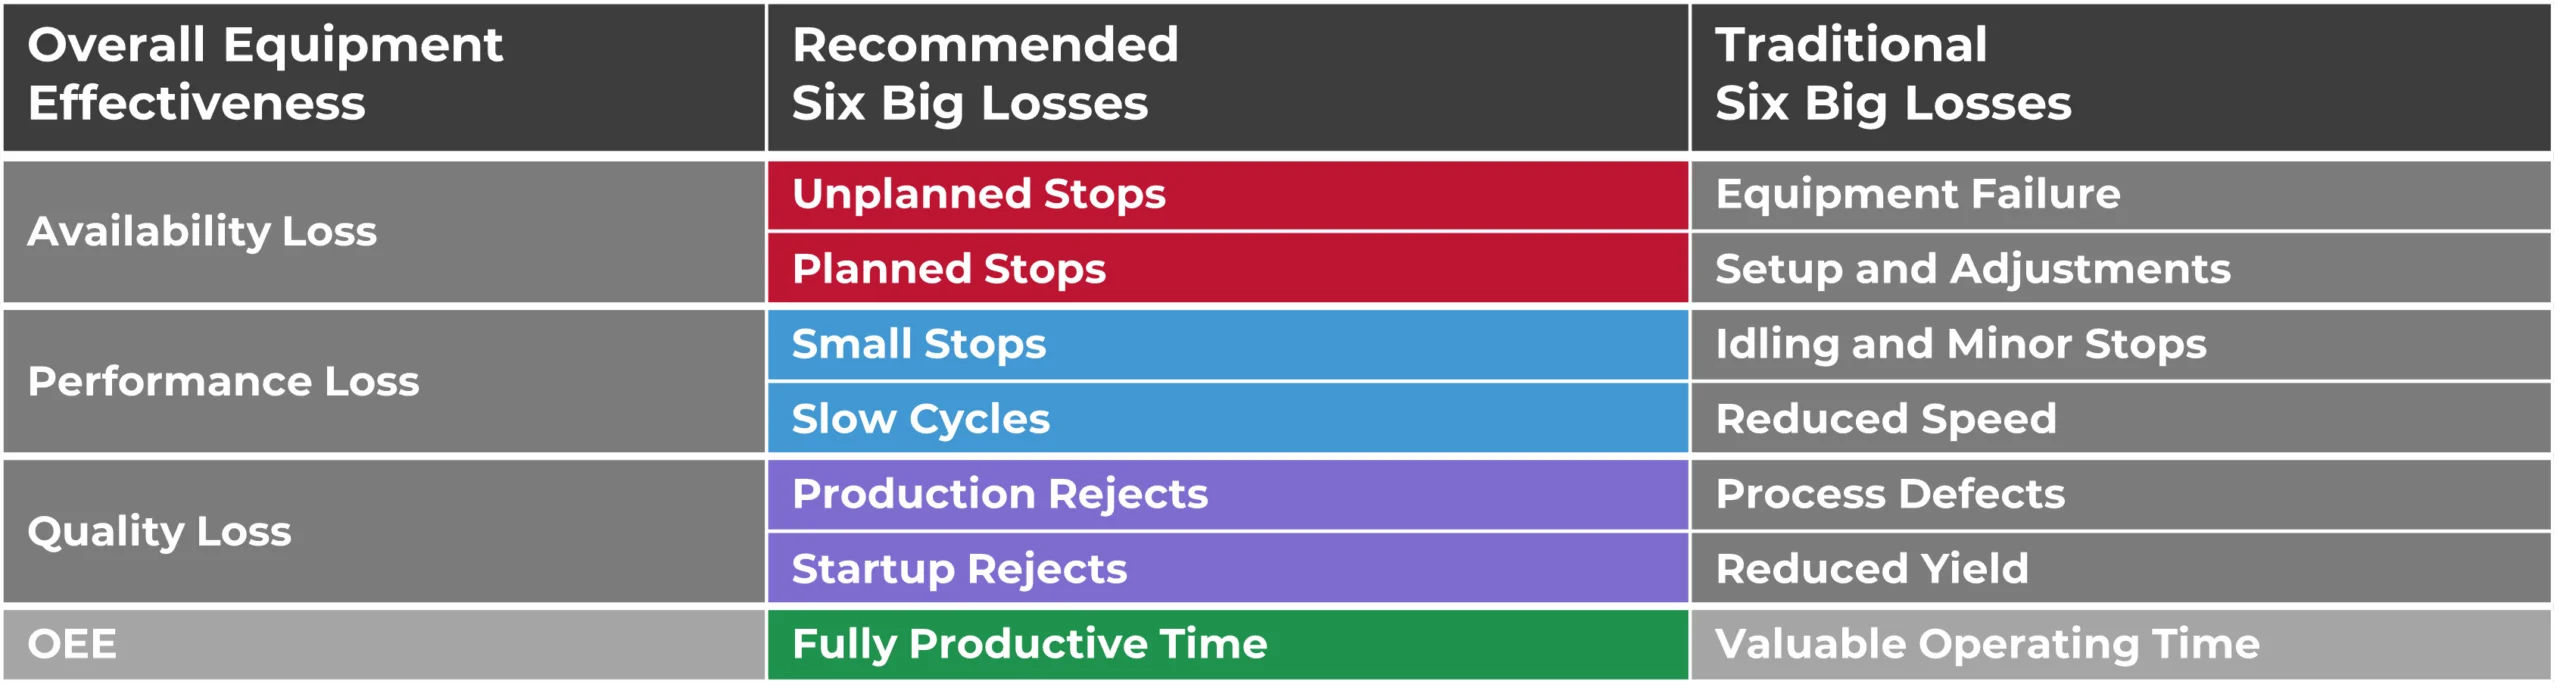
Dentro da rotina industrial, speed losses costuma ser difícil de perceber pois parte dela acaba sendo absorvida como comportamento normal da operação. Dentro da lógica de TPM e “Six Big Losses”, Seiichi Nakajima (1970), descreve perdas de performance como uma combinação entre pequenas paradas e redução de velocidade operacional. Nessas situações, a linha permanece disponível, mas deixa de operar em sua condição ideal.
Essa abordagem altera a forma como a operação interpreta eficiência industrial. Em vez de analisar apenas disponibilidade de equipamentos, a leitura passa a considerar quanto da capacidade nominal realmente foi convertida em produção sustentada ao longo do turno. Isso é particularmente importante porque uma linha pode apresentar alta disponibilidade operacional e, ainda assim, perder volume de forma recorrente devido à redução contínua de velocidade.
Na prática, isso significa que o OEE deixa de funcionar apenas como indicador consolidado de resultado e passa a atuar como ferramenta de entendimento operacional. A análise de performance começa a exigir correlação entre:
- Velocidade realizada;
- Comportamento da linha;
- Intervenções operacionais;
- Condições do processo, permitindo identificar padrões que normalmente permanecem invisíveis dentro dos apontamentos tradicionais de produção.
Nesse cenário, o papel dos dados operacionais ganha relevância não apenas pela capacidade de registrar eventos, mas pela possibilidade de contextualizar comportamento produtivo ao longo do tempo, com:
- Velocidade instantânea;
- Estados de máquina;
- Frequência de micro paradas;
- Alarmes;
- Rejeições.
O valor dessa análise está na capacidade de diferenciar situações em que a linha apresenta falhas estruturais, daquelas em que a operação reduz cadência como mecanismo de estabilização. Essa distinção se torna importante porque perdas relacionadas a micro paradas e perdas relacionadas a reduced speed normalmente exigem abordagens diferentes de melhoria contínua.
No setor de condimentos e molhos, quando a operação consegue relacionar velocidade realizada, condições do processo e impacto na capacidade produtiva, speed losses deixa de ser apenas uma percepção operacional e passa a funcionar como uma referência concreta para priorização de melhorias e aumento de eficiência industrial.
Saiba mais sobre a ST-One.